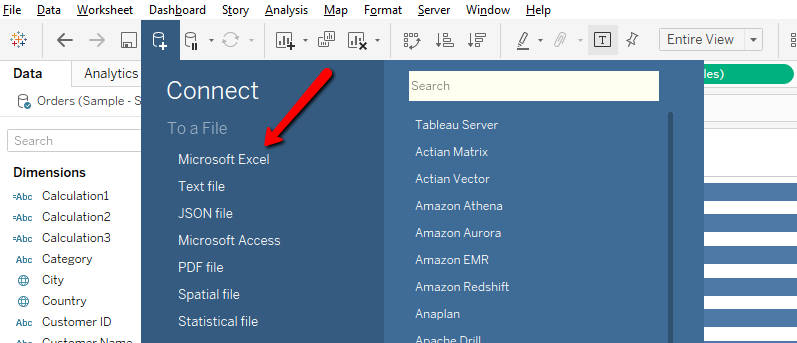
Step – 1 Open Tableau Desktop and click on New Data source icon to connect data source , for example (Sample Superstore)
Step – 2 Drag Dimension “Sub Category” into rows shelf
Step – 3 Drag “Sales” measure into Column Shelf , Hold the control button select “Sales” measure drag again into Column shelf.
Step – 4 Click on measure “Sales” and do dual axis between two measure. please look below image for reference.

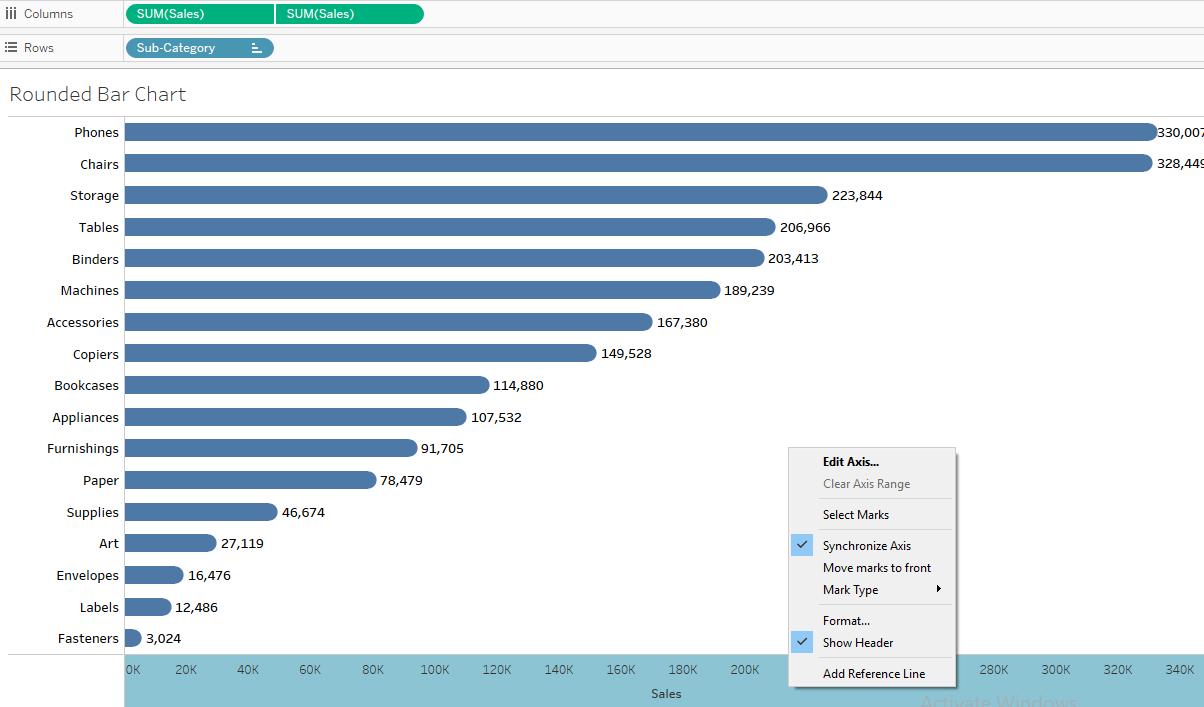
Steps – 5 Make synchronize axis between two measure.
Step – 6 Select Bar shape type for first measure from Mark shelf
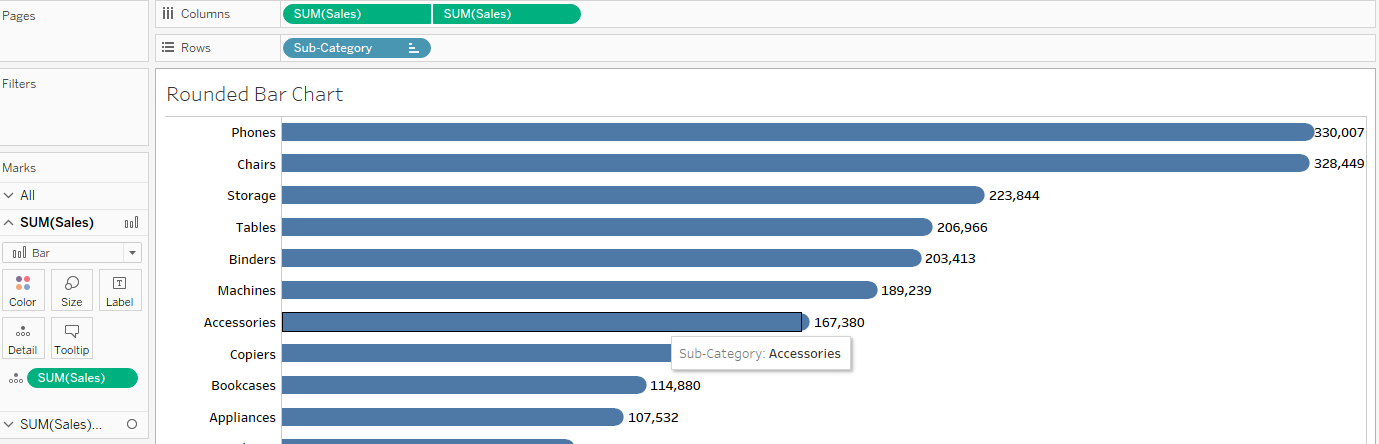
Step – 7 Select Circle shape type for second measure from Mark shelf

